

As per the World Health Organization (WHO), almost 800,000 people die every year from suicides. For each suicide that reaches it’s intended conclusion, there are 20 additional attempts that fail. For this reason, suicide prevention has been identified as a primary health objective by major health organizations, spearheaded by the World Health Organization.
The most recent openly downloadable data on global suicide rates by core demographic strata (gender, age) goes back to 2016, although various websites and organizations employ estimation techniques to ascertain suicide rates for the years that followed.
The data inputs used in this project can be accessed and downloaded here. You can also access the complete code on Github.
The primary dataset we will use contains data set from 1985 to 2016 for 101 countries. However, a look at the World Health Organization website shows that the organization has collected data for most countries from 2016. There are also updated estimates from 2019, but there is very little information available on the estimation procedures employed here.
This non-availability of suicide data provides us the opportunity to independently analyze the suicide rates for these countries and potentially identify significant socio-economic signals from other datasets that can help us evaluate the suicide rates for the remaining countries. If we do find enough features that are statistically significant, we will attempt to create a model to predict the critical suicide per 100,000 persons metric for the other countries.
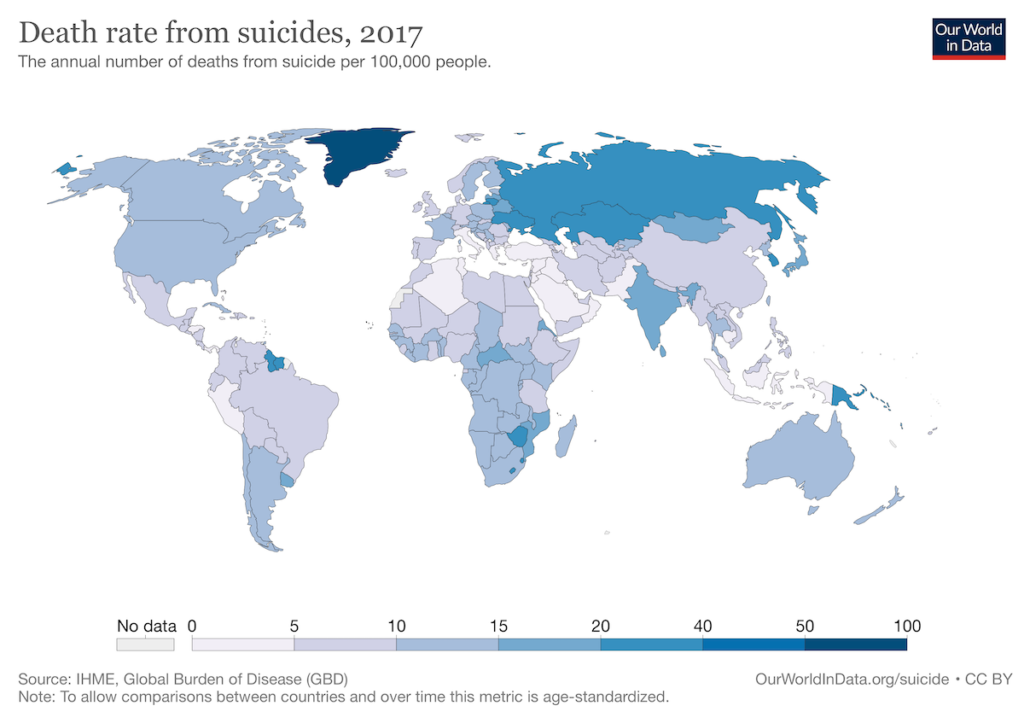
We can then compare this map with the one on WHO to see how accurate our own estimates are vis a vis data provided by the Institute of Health Metrics and Evaluation for the year 2017.
Here are the two questions that will form an integral driving force for our analysis:
- Which socio-economic indicators have a significant correlation with global suicide rates?
- Does religion seem to be a relevant factor in predicting suicide rates?

The Dataset
This project takes in the ‘Suicide Rate Overview 1985 to 2016’ dataset, which itself is ‘pulled from four other datasets’, referenced as below in the dataset description:
- United Nations Development Program (2018). Human Development Index (HDI). Retrieved from http://hdr.undp.org/en/indicators/137506
- World Bank (2018). World development indicators: GDP by country: 1985 to 2016. Retrieved from http://databank.worldbank.org/data/source/world-development-indicators
- Szamil (2017). Suicide in the Twenty-First Century. Retrieved from https://www.kaggle.com/szamil/suicide-in-the-twenty-first-century/notebook
- World Health Organization (2018). Suicide prevention. Retrieved from http://www.who.int/mental_health/suicide-prevention/en/
A Little Help: Merging Socio-Economic Data
At a later stage, we merge this dataset with two other datasets to identify potential signals that may be useful for creating an ML model to predict suicide rates for the missing countries.
- CIA World Fact Sheet, which continues ‘information on population, region, area size, infant mortality, and more’.
- Correlates of War: World Religions by University of Michigan
Disclaimer: All attempt has been made to utilize the datasets in this project in good faith as per the source’s data use policy. None of the organizations directly or indirectly mentioned herein take any responsibility for the accuracy of the dataset nor for the integrity of the analysis and predictions made below.
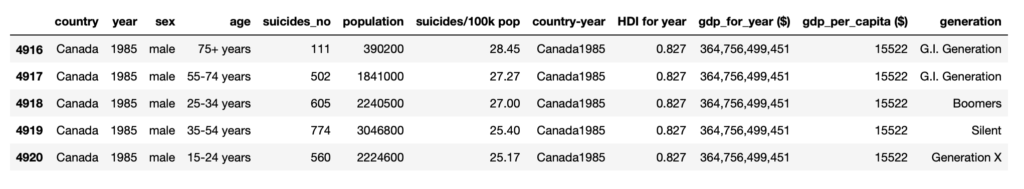
An Exploratory Look: Canada In Focus
To understand the overall data structure, let’s look at a country in particular. We look at Canada in detail, primarily as that is where the author is located and secondly because it helps provide context and comparisons for the researcher when looking at regional and global data in the following steps.
Canada: Gender-based Suicide Rate
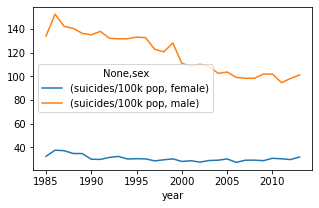
Historically, men are over 3 times more likely to commit suicide vis a vis women in Canada. There has been a gradual but significant narrowing within this gap. Suicide rates for women are relatively stable but have decreased gradually for men.
Canada: Age-based Suicide Rate
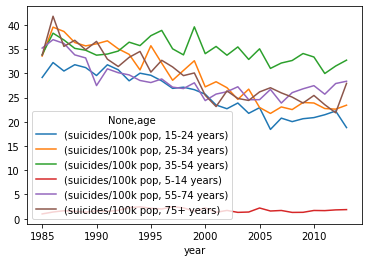
Since the early ’90s, the 35-44 age group has higher suicide rates – this gap has continued to widen. This is partly due to a more noticeable drop in suicide rates for other age groups over the last 25 years.

Cleaning & Preparation of Core Dataset
There is a noticeable drop-off in the number of countries on a year-by-year basis. For example, 2014 has data for 78 countries whereas 2013 has 80 countries. The number of countries in 2015 is reduced to 62, which is a considerable drop-off. We will therefore focus on the year 2014 in our analysis and model, as going down the lane any further will reduce the already minute number of data points (countries).
The non-availability of historical data for the countries not present in the Suicide dataset prevents us from using time series analysis for making future predictions for missing countries, which is one of our key objectives.
A Brief Glimpse At Global Suicide Rates (2014)
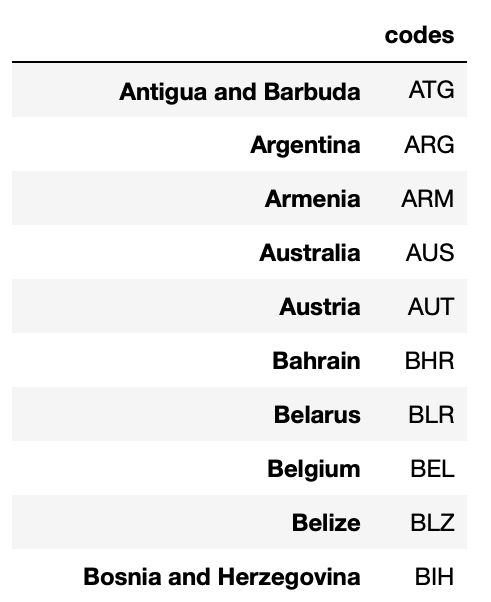
Our suicide dataset does not include ISO codes at present. We need these country codes for two reasons:
- Merging multiple datasets based on the country column, whereby the spelling and nomenclature used for some countries may differ between two datasets.
- To visualize our data using the geopandas library.
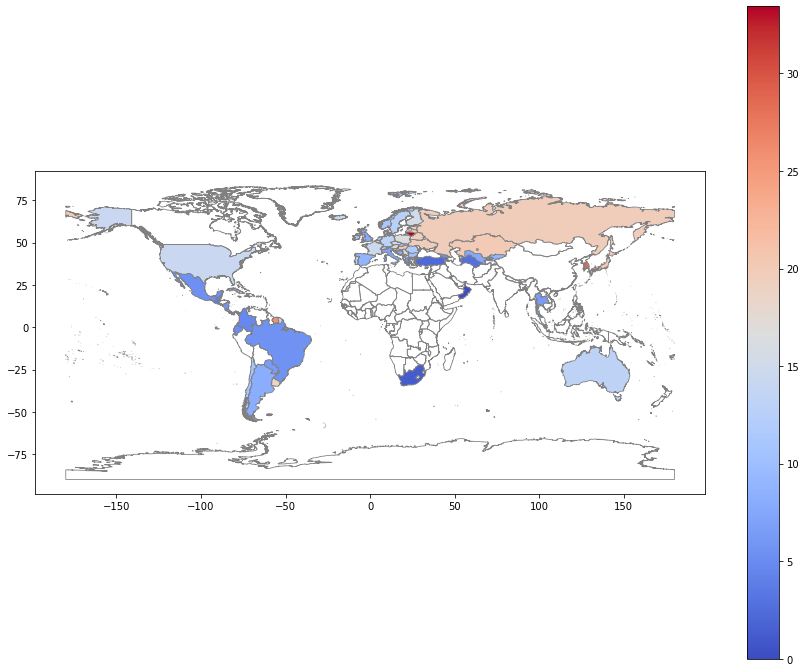
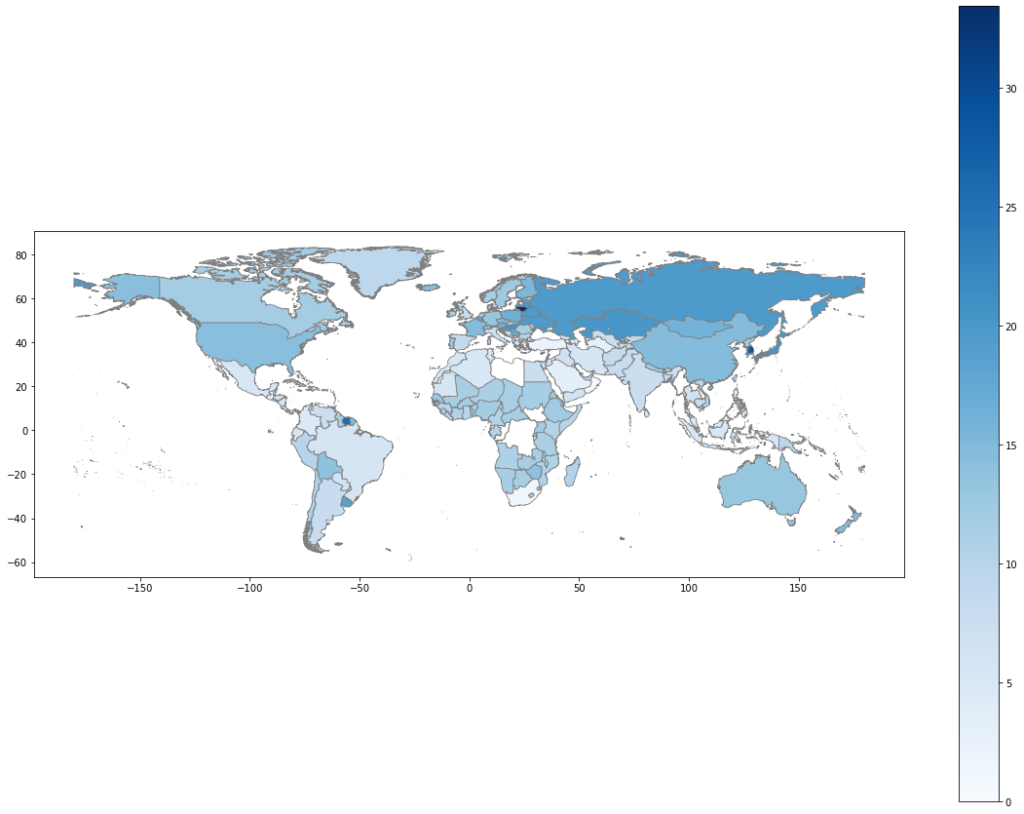
We visually observe global suicide rates for the available countries in our dataset through a choropleth map. Some key observations with regards to the visual data uncovered are as below:
- We have minimal information with regard to Africa and South Asia. This means that while regional data (continent, subregion) may still be useful, we will need a handful of statistically significant features other than geographical ones to strengthen our model.
- Mackinder’s heartland, which refers to Russia, Eastern Europe, and some Central Asian states (all former Warsaw Pact states) have the highest suicide rates from the available data.
- Canada, which we studied in detail earlier, is likely missing here due to absent data for 2014.
- In the future, we should seriously consider developing a pipeline in which we can manually enter the year (to incorporate more countries from prior years) and see how our results differ.
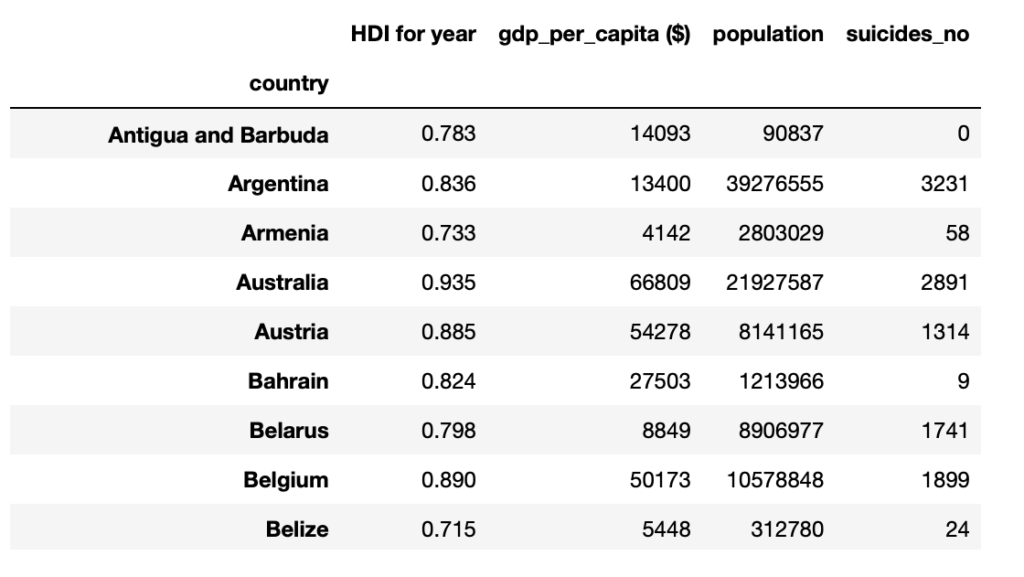
Combining Datasets: Adding Socio-Economic Indicators
We start by merging our existing data with the handy CIA World Factbook dataset which consists of a handful of key datapoint about each country in the world.
Now let’s merge this data with a dataset available on Kaggle that provides the country-wise percentage of the world’s major religions. We add this additional data since religion (or the absence of) has shown to play a fundamental role in social (and by inference, personal) attitudes and beliefs about suicide.
Prep Work for ML Model
Let’s begin by cleaning our dataset so that we can move forward towards analyzing the data. We will create a function specifically to do this just in case we intend to assemble a pipeline in the future.
Handle Missing Data
Let’s create another function that fills in null or missing values with regional averages. This will, in theory, provide us much better substitutes than simply inserting the column-wise mean value.
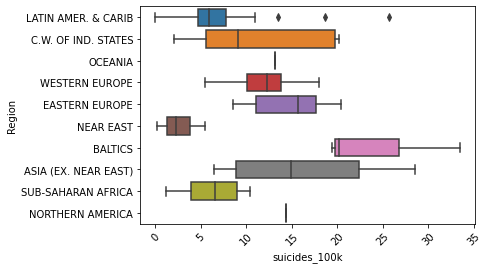
Handy Visualization: Regional Distribution of Suicide Rates
Let’s take a quick peek into the regional distribution of suicide rates with a box-and-whisker plot. As we can see, there is clearly very little data for North America and Oceania.
As we saw in the chloropleth map, the Baltics that define the Heartland have a much higher suicide rate than other regions.
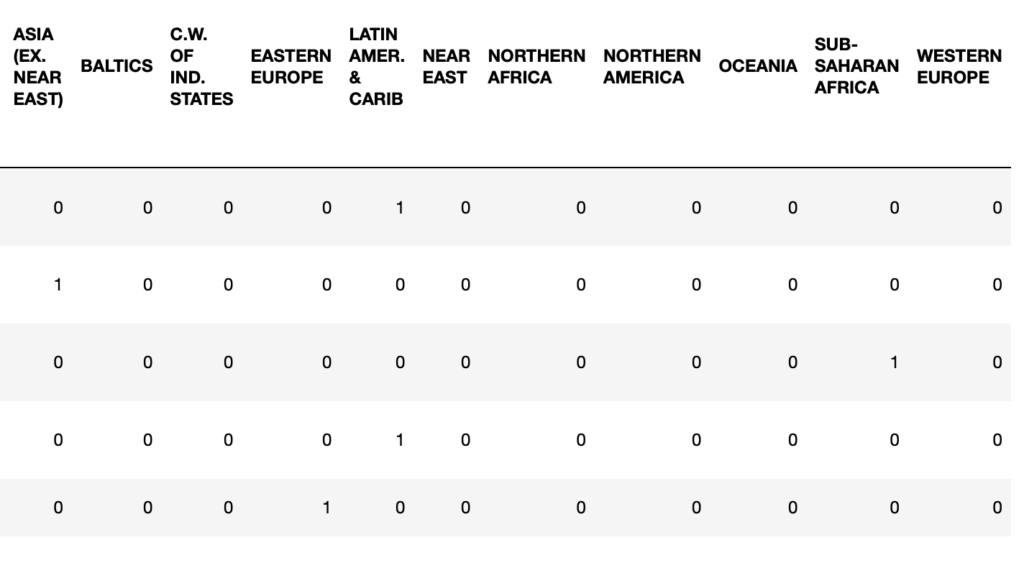
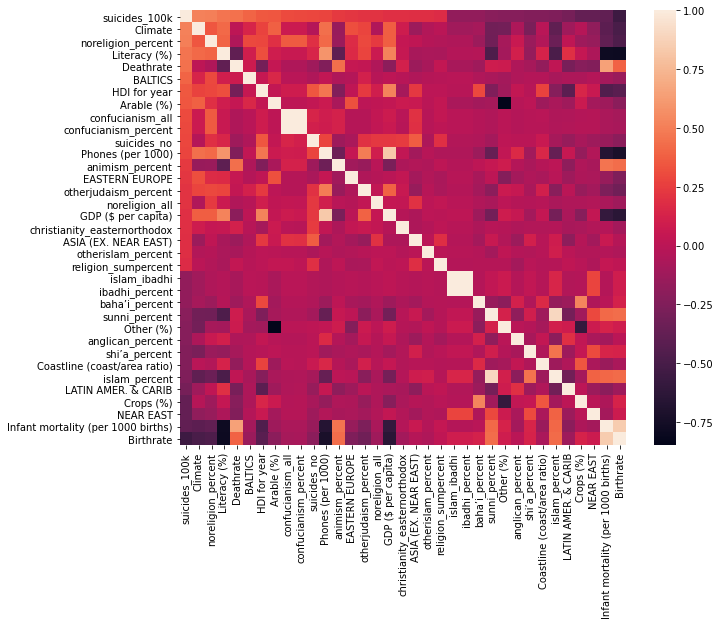
Data Correlation: Feature Nomination & Selection
Let’s create dummies for the `Region` column so that it is usable for our machine learning model.
Now that all of our feature candidates are in numerical type, let’s use Pearson’s correlation coefficient for all numerical features and our target variable, `suicides_100k`, which is what we are trying to predict for countries not included in our primary source dataset.

We already imported the seaborn library to help out in creating attractive visualizations, so let’s use it for a heatmap to visualize correlations between our features.
Machine Learning Phase
As we make final adjustments prior to initiating the ML phase, let’s remove columns that are echoing or duplicating signals or do not qualify to be used in our random forest model.
We will quickly reset the index to make the process of slicing easier.
We now rearrange our dataset so our training dataset makes up the initial index values and is then followed by our test dataset (with null values for target variable)..
Let’s try to develop and train an ML model that can help us predict the suicide rates for the remaining countries that are missing from our initial dataset.
Initiating RandomForestRegressor
We need to ensure that features with large values do not overshadow other features that may equally important indicators but have smaller values on average. Therefore, we will normalize our dataset using a SKLearn Normalizer instance.
It’s now time to neatly slice the dataset into our training set (train_X), target variable (train_y) and test set (test_X).
It is essential to always use cross validation methods to test the accuracy of the prediction model. I have opted to leave out the relevant code in the GitHub repository so that you can work out and evaluate cross-validation scores for yourself.
Let’s instantiate and train a random forest regression model using the SKLearn library.
Time to predictions using the ‘test_X’ dataset which continues data for the countries missing in our initial analysis.
Analyzing The Results
Two obvious discrepancies between our ml-driven estimation and the Our World in Data stat sheet are India and Greenland. This makes sense, as none of the reasons generally attributed to the high suicides rates for Greenland (low sunlight, loneliness, etc.) are within our features. In fact, Greenland is a real-world anomaly, with twice the suicide rate of the next country on the list. India, too, is a regional anomaly and it will always be tough predicting the suicide rate for exceptions, particularly with limited non-linear data that we had in our data set.
Another factor to consider: how much have trends changed since our year of focus (2010) and 2017.
Some more questions that worthy of further analysis:
- There is a strong positive correlation between ‘no religion’ and suicide rates, what does contemporary academic literature have to say about this?
- The percent of Muslims seem to have a negative correlation with suicide rates. Is this due to poor reporting/data collection in these countries or are their deeper reasons driven by faith and social norms?
- If the above two observations merit a closer look, what has been the trend in global suicide rates over the last 30 years in countries where both atheism/agnosticism and Islam are on the rise (primarily European countries?)
Leave a Reply